Although bulk silica itself has zero second-order susceptibility, there is a minor contribution stemming from the surface of the ECF core. This surface imposes symmetry breaking perpendicular to the optical axis, which, in turn, leads to SHG. We use the SHG generated by the bare ECF as a reference to compare against the MoS2-coated ECFs. Both optical power of the SHG and driving FW were simultaneously measured. As previously discussed, the MoS2-coated ECF has a higher loss per unit length than bare ECF due to the absorption and scattering of TMDs. To minimize loss-related effects and the impact of nonlinearly induced breakup of the pump pulse, we used a short fibre of 3.5 mm length. Figure 3a displays the recorded spectra of the FW for an averaged input power of 80 mW. The generated SH spectra are displayed in Fig. 3b and demonstrate that SHG in the MoS2-coated ECF is much higher than that of a bare ECF, irrespective of the input power. For ease of presentation, the SH intensity from bare ECF has been scaled up by a factor of 50. We also note that the SH spectrum of the MoS2-coated fibre differs in shape from that of the plain fibre, most probably due to the frequency dependence of the nonlinear response of MoS2 crystals, which has a pronounced resonance at the C exciton at 420 nm. Figure 3c shows the power dependence of the SHG in coated ECFs, revealing a quadratic dependence on the input power, as expected.
Fig. 3: SHG for horizontally polarized input light with respect to the functionalized surface in the centre of the ECF.
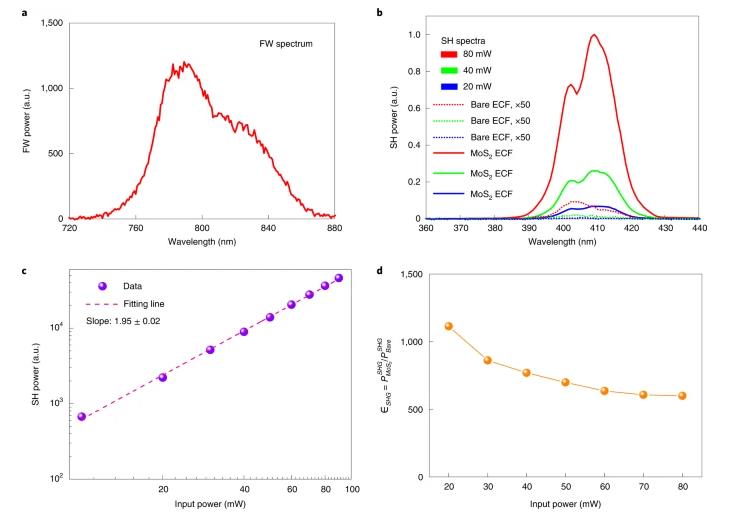
a, FW spectrum of MoS2-coated fibre at an input power of 80 mW. b, Normalized SHG spectra of both bare and coated fibres with three different input powers. The SH power from bare ECF was multiplied by a factor of 50 for ease of presentation. c, Log–log plot between SHG power and input power for the MoS2-coated fibre. d, Comparison of SHG enhancement (ϵSHG=PSHGMoS2/PSHGBare) for a range of input powers with the incident horizontal polarization.
Using bare ECFs as a reference, we systematically investigated the SHG enhancement of our MoS2-coated fibres. The comparison was made for identical input powers between a pair of equal-length ECFs by calculating the ratio of SHG power, ϵSHG=PSHGMoS2/PSHGBare. We observed a 1,113-fold increase in SHG conversion efficiency for an input power of 20 mW considerably dropping to about 600-fold for 80 mW (Fig. 3d). This drop in enhancement is most probably caused by the nonlinear effects that the TMD layer has on the FW, which may enhance FW pulse breakup for higher power levels and thus quenches SHG33. The more than 1,000 times increase in SHG is a testament to the highly nonlinear nature of MoS2, given that the fraction of power flowing in the MoS2 monolayer is calculated to be only ~3 × 10⁻⁵ (Supplementary Fig. 3b).
The role of fibre length is revealed in a cut-back experiment, in which we investigate the dependence of SHG efficiency on the fibre length (Fig. 4a). First, we measured the SHG spectrum of a 12-mm-long fibre for horizontal input polarization and then the fibre was cut to a shorter length of 3.5 mm. The specific fibre under test was densely coated with monolayer MoS2 crystals on the core region. Compared with the long fibre, the SHG efficiency increased 2.5 times for the short fibre, which is subject to further investigations and may be attributed to a reduced tendency of FW pulse breakup in the shorter fibre. By tuning the FW excitation, we can modulate the SH signal due to the wavelength dependence of the nonlinear susceptibility tensor. There are two dominant peaks in the SH spectra (Fig. 4b), that is, surrounding 620 and 660 nm; we attribute them to the resonance near the B and A exciton of the MoS2 monolayer, respectively. The enhancement in A exciton is stronger than from B exciton, although the signal from 680–690 nm was not recorded owing to the instability of OPO for those wavelengths.
Fig. 4: SHG from few-millimetre ECFs with a high-density coating of MoS2 crystals.
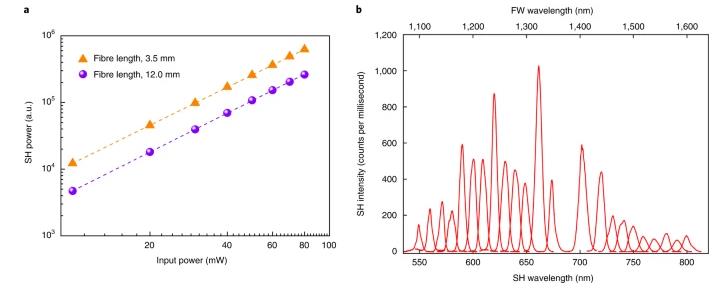
a, SHG powers of 3.5-mm-long MoS2 ECF versus 12.0-mm-long MoS2 ECF were measured with a cut-back technique. The data are presented in a log–log scale. The two linear fits exhibit a slope of 1.90 and 1.93 for 3.5- and 12.0-mm-long ECF, respectively. b, SH spectra of the 3.5-mm-long MoS2 ECF over a wide range of excitation wavelengths. The fibre was excited by an OPO laser, which has a repetition rate of 80 MHz and pulse width of 180 fs. The output power was fixed at 10 mW for all the FW wavelengths.
Tunability of SHG by input polarization
We next investigate the dependence of FW on input polarization by tuning it from horizontal (0°, in plane with the functionalized surface) to vertical (90°, out of plane with the functionalized surface) (Fig. 5a, black line). The power was fixed in this measurement. As expected, the SH intensity is the highest for the horizontal polarization of the input beam. By altering the input polarization, the SH intensity drops to a minimum at 40° before increasing again at 90°. A pulsed Ti:sapphire laser with a central wavelength of 800 nm was used in this measurement on the 12-mm-long coated ECF.
Fig. 5: SHG tunability.
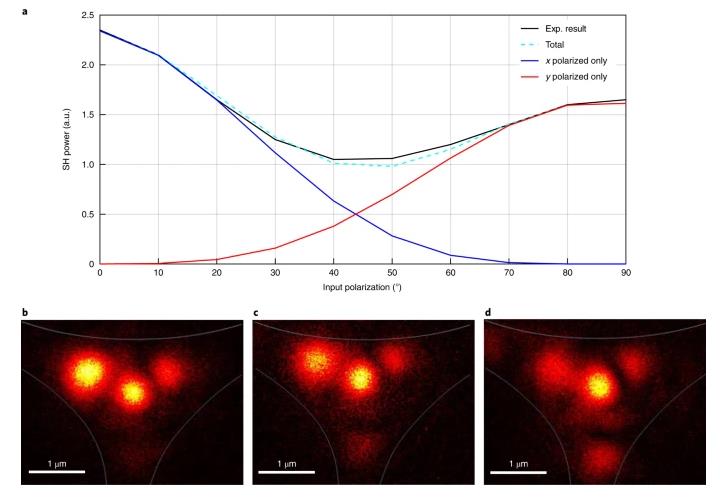
a, SH intensity versus input polarization compared with the functionalized surface; 0° indicates horizontal polarization and 90° denotes vertical polarization for both experimental result and numerical calculation. Here x and y polarizations mean the near-degenerate fundamental modes with mostly horizontally or vertically polarized directions, respectively. b–d, Experimentally acquired images of the light distribution of the SHG field at the facet of a MoS2-coated ECF. Input polarization at 0° (b), 40° (c) and 90° (d).
This functional dependence is a result of the projection of the FH field onto the horizontal parts of the ECF surface scaling like the cosine, which is squared in SHG resulting in a total SH power (PSH) proportional to the fourth power of the cosine of the input polarization angle. The same applies to vertical parts of the surface, where the cosine is replaced by the sine. Mixed angular terms (for example, products of squared sine and cosine) critically depend on the geometry and are assumed to be almost negligible from the actual multimodal ECF structure. Decomposition into these two components yields the following expression:
PSH≈P0(cos4(θ)+ϱsin4(θ)).
(1)
A rigorous derivation of this formula is presented in Supplementary Section 4.4. The experimental results are well approximated by this formula, as evident from the fitting of the experimental data to equation (1) (Fig. 5a). Here θ is the polarization angle with respect to the x axis and P0 is the nonlinear response resulting from the joint interaction of all the possible SH modes at θ = 0. Furthermore, ϱ is the relative impact of the SHG excited by a horizontal FW as opposed to the vertical FW. We experimentally found ϱ = 1.23 from fitting the model. A comparison with the simulation value of ϱ = 4.0, determined from the calculated modes of the structure (Supplementary Section 4.4), is an acceptable agreement to the measured value given the simplicity of the model and the number of approximations made in its derivation.
The complex multimodal nature of the process is also underlined by the structure of the SH modes that are mapped as a function of input polarization (Fig. 5b–d). It can be seen that neither of the intensity distributions is completely symmetric due to the asymmetric structure of the fibres themselves. Note that the SH-field profile does not dramatically vary with input polarization. This is consistent with the data collected from Supplementary Fig. 12, where the overlap coefficients can be seen to quantitatively differ between two SH modes but also that the ratio between the horizontal (x) and vertical (y) input polarization of the same mode is roughly maintained for all the modes.
Nonlinear susceptibility from an individual MoS2 crystal
We must clarify that the data needed to produce Figs. 4b and 6 were not measured from the same fibre. In this experiment, we have used a fibre with a low-density coating of MoS2 crystals to easily locate the position of every single crystal by PL mapping. The distance between adjacent crystals ranges from tens to hundreds of micrometres. To quantitatively evaluate the SHG efficiency of our MoS2-coated ECFs, we removed all the crystals from an ECF, except one by pulse laser ablation. Details on the removal of MoS2 crystal are given in Methods and Supplementary Section 2.2. The original ECF has a length of around 12 mm and exhibited 30 MoS2 crystals on the fibre core. Using a pulsed laser at the central wavelength of 515 nm, the TMD crystals can be thermally removed. To do so, the laser beam was translated along the entire fibre length with a speed of 100 µm s–1; a section of the fibre with a single monolayer crystal was covered by a silicon wafer. The fibre was subsequently analysed using a PL microscope at prerecorded locations of all the crystals to verify their successful and complete removal. The remaining crystal was chosen to be oriented with a symmetrical axis perpendicular to the fibre axis, such that the nonlinear tensor was well aligned with the input polarization (Supplementary Fig. 6).
Fig. 6: SHG and PL before and after the removal of MoS2 crystals on a low-density coated ECF.
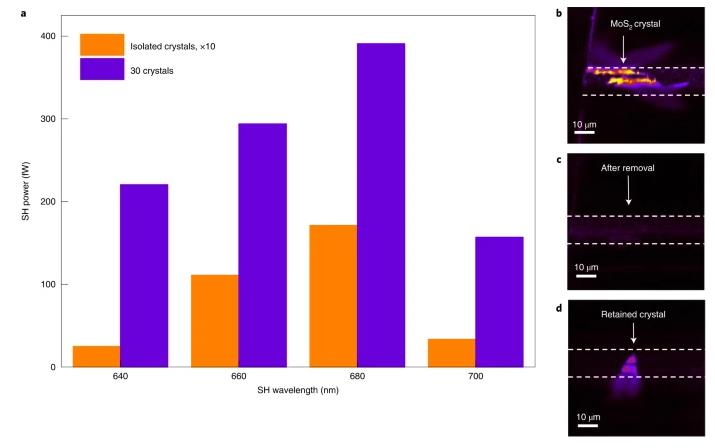
a, SH power generated from 30 monolayers versus isolated monolayers on an identical ECF obtained by the ablation process. b, PL map from a typical MoS2 crystal before removal. The white dashed line displays the bottom of the exposed surface. c, PL map after the removal of the crystal in b using a pulsed laser at 515 nm. d, PL map from the retained crystal.
The experimental setup was also slightly modified. The excitation wavelength was set from 1,280 to 1,400 nm because the reliable reference data for the χ(2) coefficient of MoS2 was available and the loss is less pronounced. Moreover, in this FW-wavelength range, we can sweep over the A- and B-exciton resonances, which are indicative of the SHG being generated by the MoS2 crystal. The setup shown in Supplementary Fig. 8 was also calibrated to infer absolute SHG power levels from noise-corrected grey-scale images to enable a quantitative analysis. The input power was set such that 7 mW propagated through the fibre.
Figure 6a displays the SH power from the ECF before crystal removal (where 30 crystals contribute) and after removal (with individual crystals). Both cases have the highest SHG at 680 nm, consistent with the A-exciton energy of MoS2. These findings underline that the origin of the SHG is indeed from monolayer crystals. The SH signal from the individual crystals is lower by a factor of 15 to 25, depending on the wavelength, roughly consistent with their respective quantities. This ratio is caused by the crystal’s random spacing and orientation leading to the incoherent addition of their individual SHG contributions. Near the B-exciton energy at 640 nm, the SHG ratio between multiple and single crystals is considerably higher. This is probably due to the different dynamics of this type of exciton in the case of multiple crystals. The successful removal of typical unwanted MoS2 crystal on the fibre core and retaining the isolated crystal is confirmed by PL mapping (Fig. 6b–d). The strong PL emission from the retained isolated crystal is shown in Fig. 6d.
Discussion
Using the measured SHG power from the isolated MoS2 monolayers and the simulation data of the mode properties given the crystal length and orientation, we determine an experimental conversion efficiency of η = 0.2 × 10⁻³ m–2 W–1 at λFW = 1,360 nm and χ(2) of 44 pm V–1. This value is much higher than previously discussed SHG-functionalized fibres, for example, based on germanium-doped glass (1 pm V–1)36. The overall conversion efficiency is still low, which is mainly due to the short crystals, lack of phase matching to the fundamental SH mode and only moderate mode overlap. We argue that the conversion efficiency considerably increases by enhanced fabrication methods to grow highly oriented and large-sized monolayers, which are an active field of research. Phase-matching techniques are a well-established topic in fibre design, and only need to be applied to the specific problem at hand. The easiest leverage is, however, the enhancement of mode overlap. As a proof of concept to further enhance the nonlinear conversion efficiency, we show that a simple 25-nm-thick coating of HfO2 on the TMD monolayer can increase the conversion efficiency 600-fold up to η = 0.1 m−2 W−1 (Supplementary Section 4.3), which is indeed a value that would be useful for first applications.
Apart from nonlinear light conversion, this work may extend into fibre-based remote sensing because SHG has proven to be an effective and non-destructive method to monitor strain in 2D materials37,38. Light conversion in waveguides functionalized with 2D materials shows strong potential for further work to optimize the nonlinear conversion efficiency by optimizing the field overlap and mutually growing oriented crystals. Additionally, ECFs provide free access to nonlinear crystals, which can be actively patterned to make a coherent buildup of the SH field.
Conclusions
In summary, we have demonstrated in-fibre SHG from an optical fibre with a silica core by functionalization of the core with a highly nonlinear monolayer of CVD-grown MoS2. This approach of using single crystals on ECF can also be used as a characterization tool for 2D materials. Through the measurement of isolated TMD monolayer crystals on the silica fibre, we are able to quantify the second-order response of this atomically thin semiconductor and the TMD–fibre hybrid. In contrast to bare ECF, we observed considerable SHG, most notably from a 3.5-mm-long fibre with a dense multicrystalline coating. Further enhancement can be expected by tuning the phase matching, optimization of field overlap and growth of mutually oriented crystals or large monocrystalline films. The scalability of this CVD-based deposition process is possible and can be expanded to other fibre types and materials. This work establishes a highly versatile photonic platform to further investigate the optoelectronic properties of 2D TMDs, with an interaction length that is no longer limited by the monolayer material thickness but by the fibre length. Efficient, fibre-based, three-wave mixing components may eventually be possible, with application scenarios such as SHG sources, OPOs/OPAs, optical modulators, optical signal processing or spontaneous-parametric-downconversion-based photon-pair sources. The longer interaction length and unusual polarization geometry may also help explore excitonic properties, for instance, related to dark excitons in XSe2-type materials. As SHG is a reliable indicator of strain, this work may also expand the applicability of fibre-based sensors and active fibre networks.
Methods
ECF fabrication
The all-silica (SiO2) ECF was manufactured using an ultrasonic drilled silica preform with the opening on one side of the central section of the fibre to make the exposed core. During the drawing process, the glass and air holes are heated to the glass transition temperature in a furnace in a typical temperature range of 1,900–2,000 °C. The preform was canned and inserted into a jacket tube and then drawn into an ECF. The optical fibre has a comparable geometry to the preform, except for the smaller size and much longer length. The fabricated fibre has an outer diameter of 175 µm and effective core diameter of 2 µm. Because of the chemically inert and temperature-stable process, silica fibre has minimal internal stress due to heating and cooling. It can sustain both temperature and atmosphere condition of the CVD process. The cross-section and geometry of our ECFs are shown in Supplementary Fig. 1.
CVD growth of MoS2 on fibres
MoS2 crystals were grown on the ECFs by a modified CVD technique, where a Knudsen-type effusion cell was used to deliver the sulfur precursor. Metal oxide MoO3 powder was used as the source of the transition metal atoms. Both MoO3 and ECF were put in the second zone of the split-tube furnace and heated up to 770 °C at a rate of 40 °C min–1, whereas the sulfur precursor was positioned in the first zone and heated up to 200 °C. The precursor species were carried out by argon gas with a flow of 100 cm3 min–1 at atmospheric pressure. After the growth time of 20 min, the furnace was turned off and cooled down to room temperature. The grown MoS2 on the ECFs were characterized using optical microscopy (ZEISS Axio Imager Z1.m) and Raman spectroscopy (Bruker Senterra spectrometer operated in the backscattering mode using 532 nm wavelength obtained with a frequency-doubled Nd:YAG laser, together with a ×100 objective and thermoelectrically cooled CCD detector).
PL mapping and spectroscopy
PL and crystal size were mapped with a commercial confocal PL-lifetime microscope (PicoQuant MicroTime 200), using a 532 nm laser for excitation. The maps were achieved by moving the focus of the ×100 microscope objective along the ECF core. The device has a spatial resolution of the order of 0.5 µm. The fibre was placed flat on the specimen table and thus perpendicular to the optical path. The PL signal was detected by a single-photon avalanche diode after passing through a series of band-pass filters. The PL spectra were recorded by a grating spectrometer (Horiba Jobin Yvon Triax) equipped with a cooled CCD camera.
Transverse in-fibre PL mapping
PL was excited with a 532 nm CW laser (Lighthouse Photonics Sprout). A scientific complementary metal–oxide–semiconductor camera (Zyla 4.2 plus) was laterally mounted together with a ×10 objective to image the sideways PL emission from the grown crystals. A set of 550 nm long-pass filters was utilized to reject the scattered excitation laser. The camera and objective were mounted on a translational stage to map the entire length of the fibre.
SHG measurements
Nonlinear experiments were performed with a femtosecond pulsed laser with a duration of 162 fs at a central wavelength of 800 nm at a repetition rate of 80 MHz (pulsed Ti:sapphire laser, Coherent) and focused into the fibres with an aspheric lens. The laser was strongly chirped (short-wave light arriving before the long-wave light), the transform-limited pulse duration is in the range of 20 fs. No attempt at chirp compensation was undertaken. The signal leaving the ECF was collimated with a microscope objective and coupled into a Horiba spectrometer (Horiba Jobin Yvon Triax) with a cooled Si CCD detector to measure the FW and SH spectra. A band-pass filter was utilized to cut off the laser excitation.
MoS2 crystal ablation
To obtain a single monolayer on the ECF, we have used a Pharos laser system from Light Conversion to thermally ablate the unwanted crystals on the fibre core. The laser has a pulse width of 200 fs, central wavelength of 1,030 nm with a frequency doubled to 515 nm, and a repetition rate of 100 kHz. The laser beam was put on a translational stage with a scanning speed of 100 µm s–1 and the light beam was focused by a 200 mm focal lens on the bottom of the exposed surface. The width of the ablated region is approximately 60 µm, which is helpful to remove all the crystals not only on the core region but also on the curved wall nearby with a pulse energy of 4 µJ. To protect the chosen monolayers, a silicon wafer with a dimension of 1 × 1 cm2 was covered on top of the fibre near the edges during the ablation process.
SHG from isolated MoS2-monolayer measurement
This experiment was accomplished with an OPO (Mira OPO-X from APE) pumped by a Ti:sapphire mode-locked laser (Chameleon Ultra II, Coherent) with a repetition rate of 80 MHz, pulse duration of 140 fs and generating tunable pulses from 1.0 to 1.6 μm. The SHG from the fibres was imaged onto a thermoelectrically cooled scientific complementary metal–oxide–semiconductor Thorlabs camera with a medium read noise of 1.4746 e− (r.m.s.) and gain of 0.4853 e− (electron) per ADU (analog to digital unit). The quantum efficiency is taken from the datasheet of the camera. The signal loss of our experiment setup was determined to be 36.6%. All the signals recorded from the camera were compensated for this loss.